

Stock Markets
Since ancient times there has been trade, there has been a lull and a decline in trade. The stock market is prone to crashes – the global stock market sees a crash about once every 10 years, and there have been four historic market crashes in the last century. Although many traders always have the threat of a stock market crash in the back of their minds, it is important for traders to understand the history of these crashes in order to understand the causes and effects of crashes.
What is a Stock Market Crash?
A stock market crash is considered to have occurred when a major market index such as the S&P 500 or the Dow Jones Industrial Average falls more than 10% in a single trading day. However, this definition is flexible and a stock market crash can be repeatedly identified as a double-digit drop over the course of a few days. Importantly, the crash should be market-wide, covering multiple industries and sectors.
Stock market crashes are often caused by investor panic, which builds on itself to promote selling activity and drive the market lower.
Crash vs. Repair
The main difference between a stock market crash and a market correction is the timing of the decline in prices. While crashes occur within one trading day or several days in a row, corrections occur gradually. A stock market correction usually takes more than a week, and sometimes several months, to achieve a 10% or greater decline in the number of major indexes.
Note that crashes are also different from bear markets. A bear market occurs when major indexes fall 20% from their most recent high, usually over a period of several weeks to months. Although a crash may mark the beginning of a bear market, not all stock markets result in a bear market.
Crash Examples
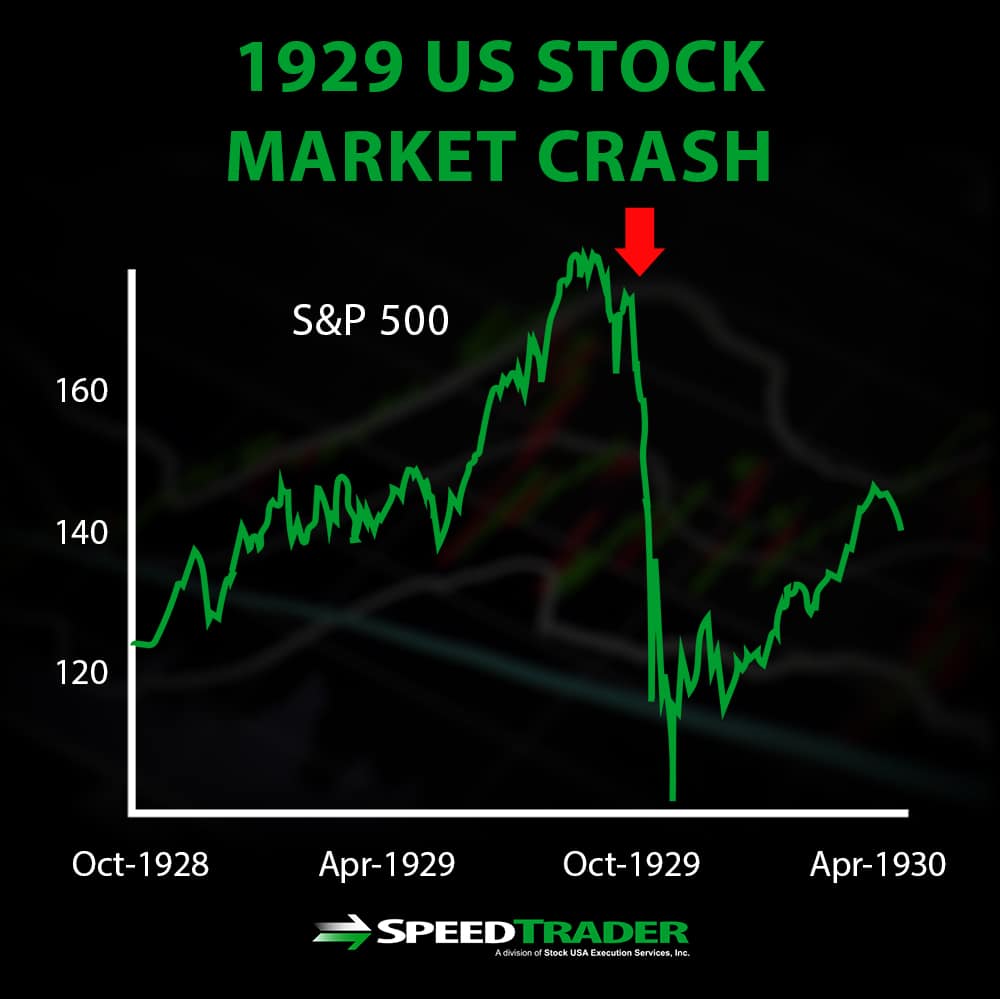
1929 US Market Crash
The stock market crash of 1929 occurred over four days in October 1929, sending the Dow Jones Industrial Average down 25% and wiping out the modern equivalent of $396 billion in wealth. The sell-off started with an 11% drop on the first day, which was halted by Wall Street bankers buying stocks to support the market. However, this buy was short-lived and the Dow lost 13% and 12% on the third and fourth day of the crash.
The US stock market was set to crash due to widespread, aggressive market speculation. Buying stocks on margin at brokerages was introduced in 1922, enabling investors to buy stock using borrowed money. In addition, many ordinary people had started investing in the market because it was very strong during the 1920s.
Shortly before the crash, Press Secretary and Treasury Secretary Andrew Mellon began to highlight the extreme level of speculation taking place in the market. This caused panic in the public, and it even intensified in the days before the accident as the papers then revealed the panic of the investors.
The results of the crash were so tragic, it actually started the Great Depression. Consumers quickly call for margin loans, many banks go out of business – taking people’s money – and inflation lowers the value of money. The market remained very strong until 1933, and did not fully recover until World War II came in 1939.
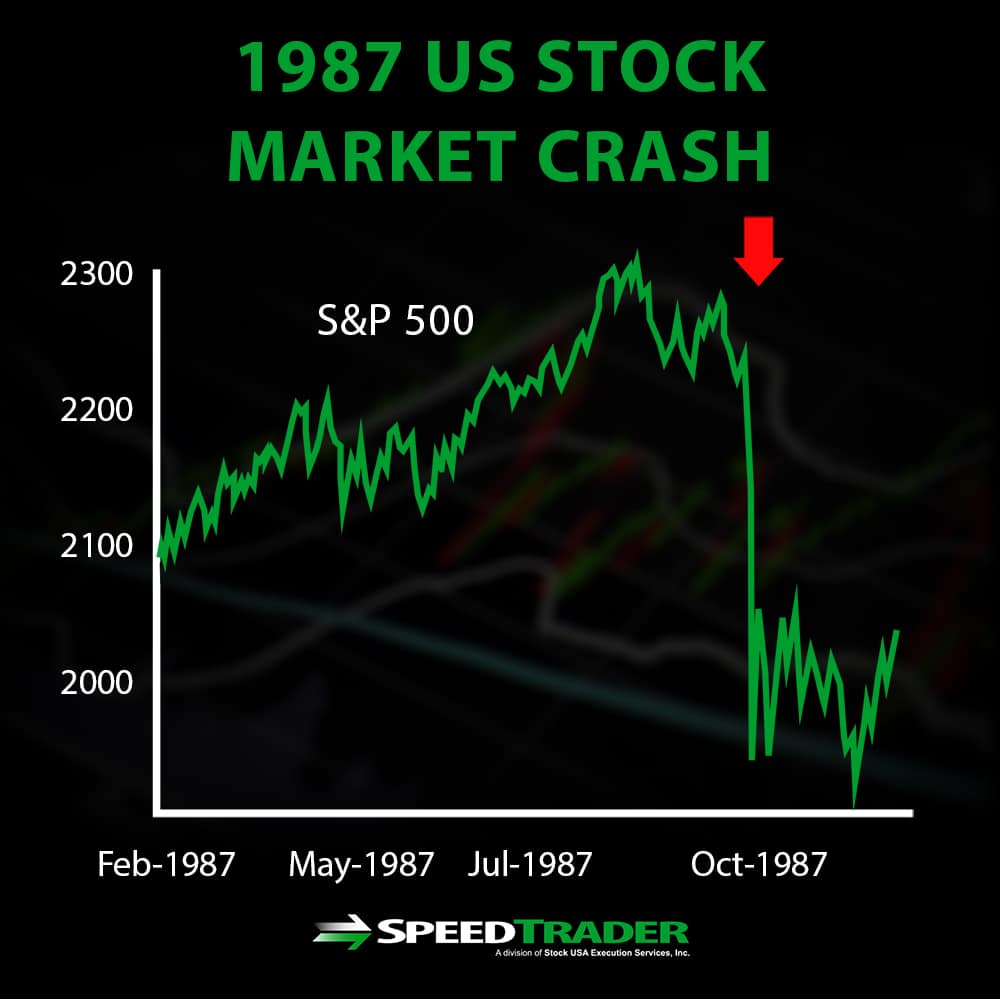
1987 US Market Crash
On Monday, October 19, 1987 – now known as Black Monday – the Dow Jones Industrial Average lost nearly 22% of its value. The crash occurred shortly after the introduction of computer-based trading, which may have amplified the effects of the crash as it automatically triggered stop-loss orders that piled up in the market as it fell.
The crash caught traders by surprise, but there were early warning signs. In the US, economic growth was slowing as forecasts for future earnings declined and inflation began to increase. At the same time, price-to-earnings ratios continued to increase and the advent of portfolio insurance encouraged traders to take greater risks during the bullish market.
The crash lasted only one day since computerized stop-loss orders were widely used at the end of the trading day as the market fell. The crash did not lead to a true bear market, although it did mark the end of years of bear market activity. After the crash, the exchange puts in place several procedures to stop trading in the event of another crash driven by computer commands.
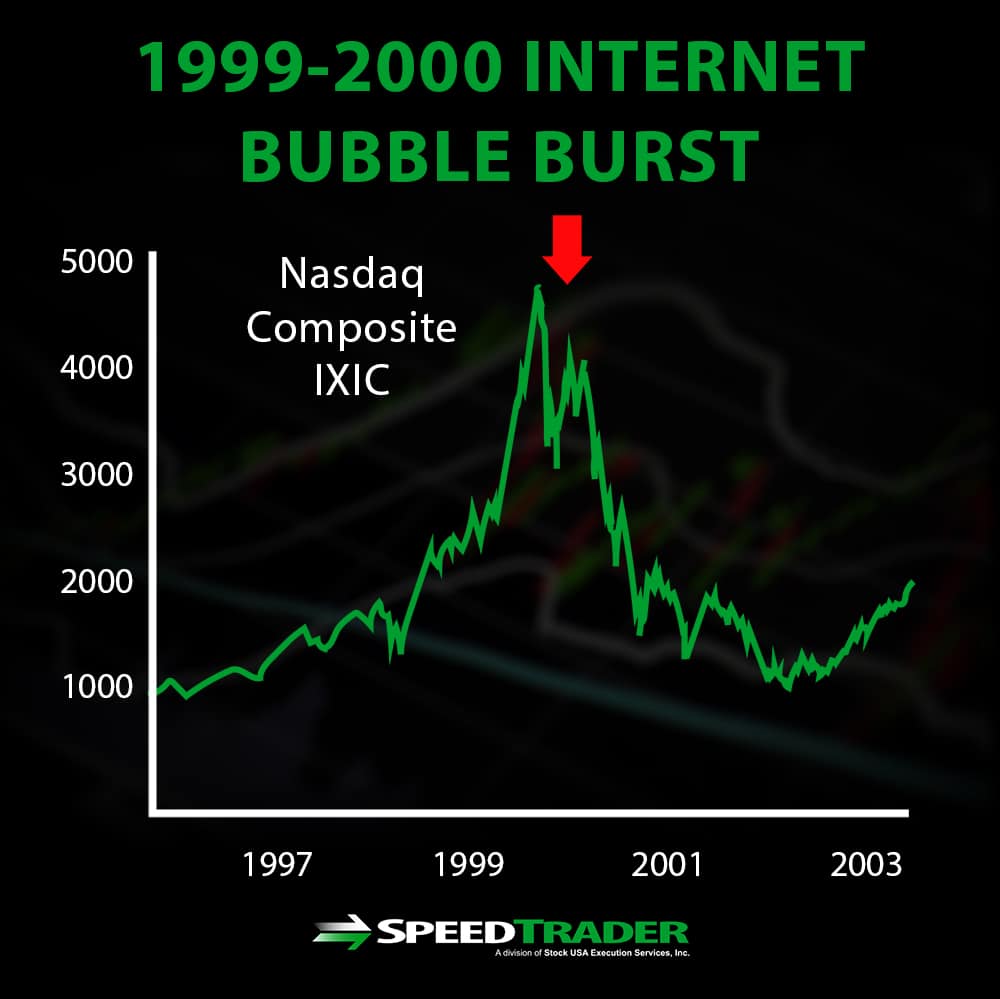
1999-2000 Internet Bubble Burst
The bursting of the dot-com bubble began on March 11, 2000, and continued until October 9, 2002. Unlike other historical crashes, this crash happened over a very long period of time, with several days when the Nasdaq index lost more than 10% of its value. By the end of the recession, the Nasdaq had fallen 78% from its peak in 2000 and the stock market had lost $5 trillion in market capitalization.
The growth of the Internet happened very quickly after it was introduced for public and commercial use. In 1999, there were more than 400 technology-related IPOs, and many of those doubled in value in their first days of trading as investors wildly speculated on the potential of the Internet. Many technology-related companies were earning 1,000% or more annual returns in the late 1990s, and the tech boom had encouraged the general public to invest directly in technology stocks.
To make the problem worse, the valuation of many of these companies was based on ideas rather than actual business models. The dot-com bubble was characterized by venture capitalists giving large sums of money to companies with big ideas, even if these companies had not yet proven that their business models could be profitable or that they could scale appropriately.
Following the crash, only about half of the dot-com companies that had gone public survived. Investor confidence has been slow to return, especially given the revelations of several financial scandals during the recession. Ultimately, the remaining tech companies were able to consolidate and grow by dominating their sectors, such as Amazon, eBay, and Google.
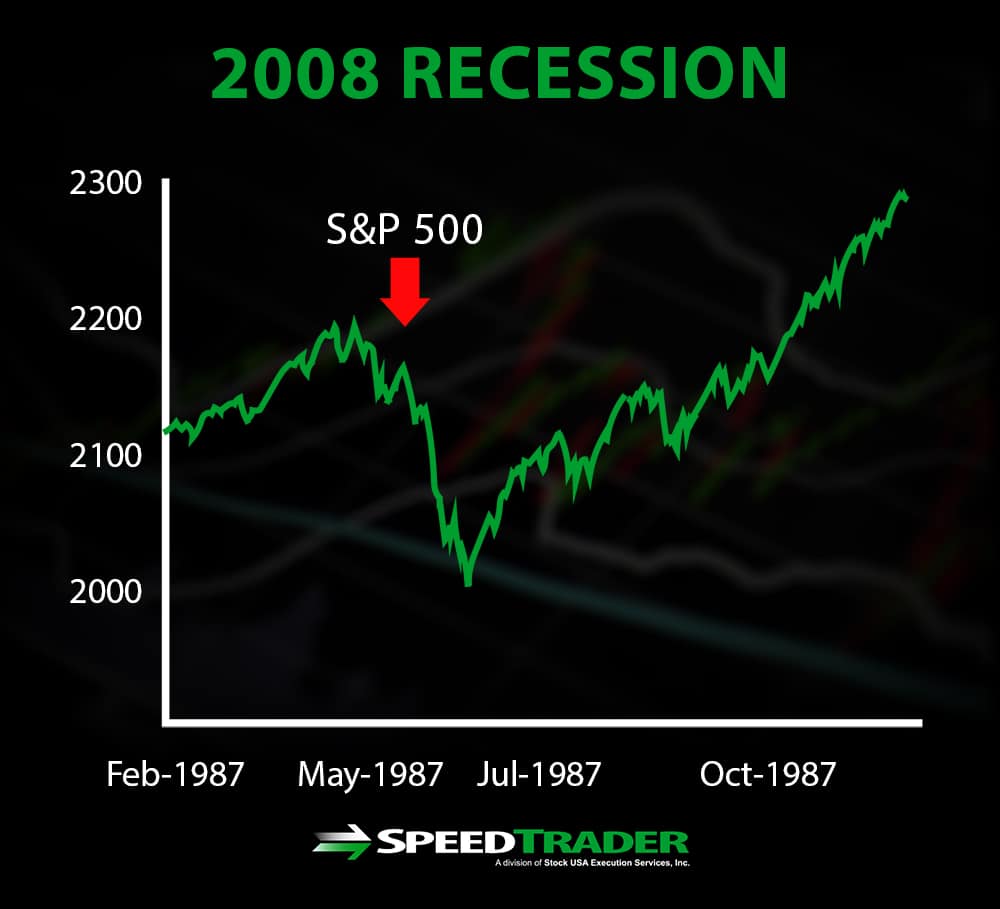
2008 Recession
The 2008 recession occurred during 2007-2009, but the Dow Jones Industrial Average experienced its largest single point loss (at the time) on September 29, 2008. The index lost 778 points, or about 8% of its value. A few days later, the index lost 8%.
This huge loss occurred because the US Congress failed to pass a bailout bill, but the economic damage was widespread. Loans were closed at this time, as banks were not willing to lend to each other. The Dow continued to fall another 13 percent in October 2008 as GDP fell 0.3 percent, signaling the beginning of a recession. Finally, the Dow fell by more than 50 percent between October 2007 and March 2009.
The recession was largely caused by banks issuing subprime mortgages, which was made worse by the fact that a large number of people took advantage of the low-interest loans. Eventually, even insurance companies like AIG, which had backed these loans, were caught in the financial crisis as loan repayments stopped and banks began freezing loans.
The recession of 2008 was the worst economic crisis in the US since the Great Depression and its effects around the world. The US was able to prevent a complete collapse of the economy by bailing out banks, insurance companies, and large industries such as the auto industry. The fear surrounding the stock market continued until 2013, when investor confidence finally drove the Dow to record gains.
The conclusion
Stock market crashes are part of the stock market cycle. Although each historical crash has different causes and effects, over-speculation in risky assets is a common thread. It is important for traders to be aware of broader market trends and warnings about major risks in the stock market in order to prepare for future crashes.


